


A scoop of poo.
If you have IBD and you’re under my care in Edinburgh, I’ll ask you for it. Regularly, for years. Some people find it weird. Most eventually find it reassuring. Because it gives us something symptoms and clinic appointments can’t: an objective readout of what’s happening in the gut wall.
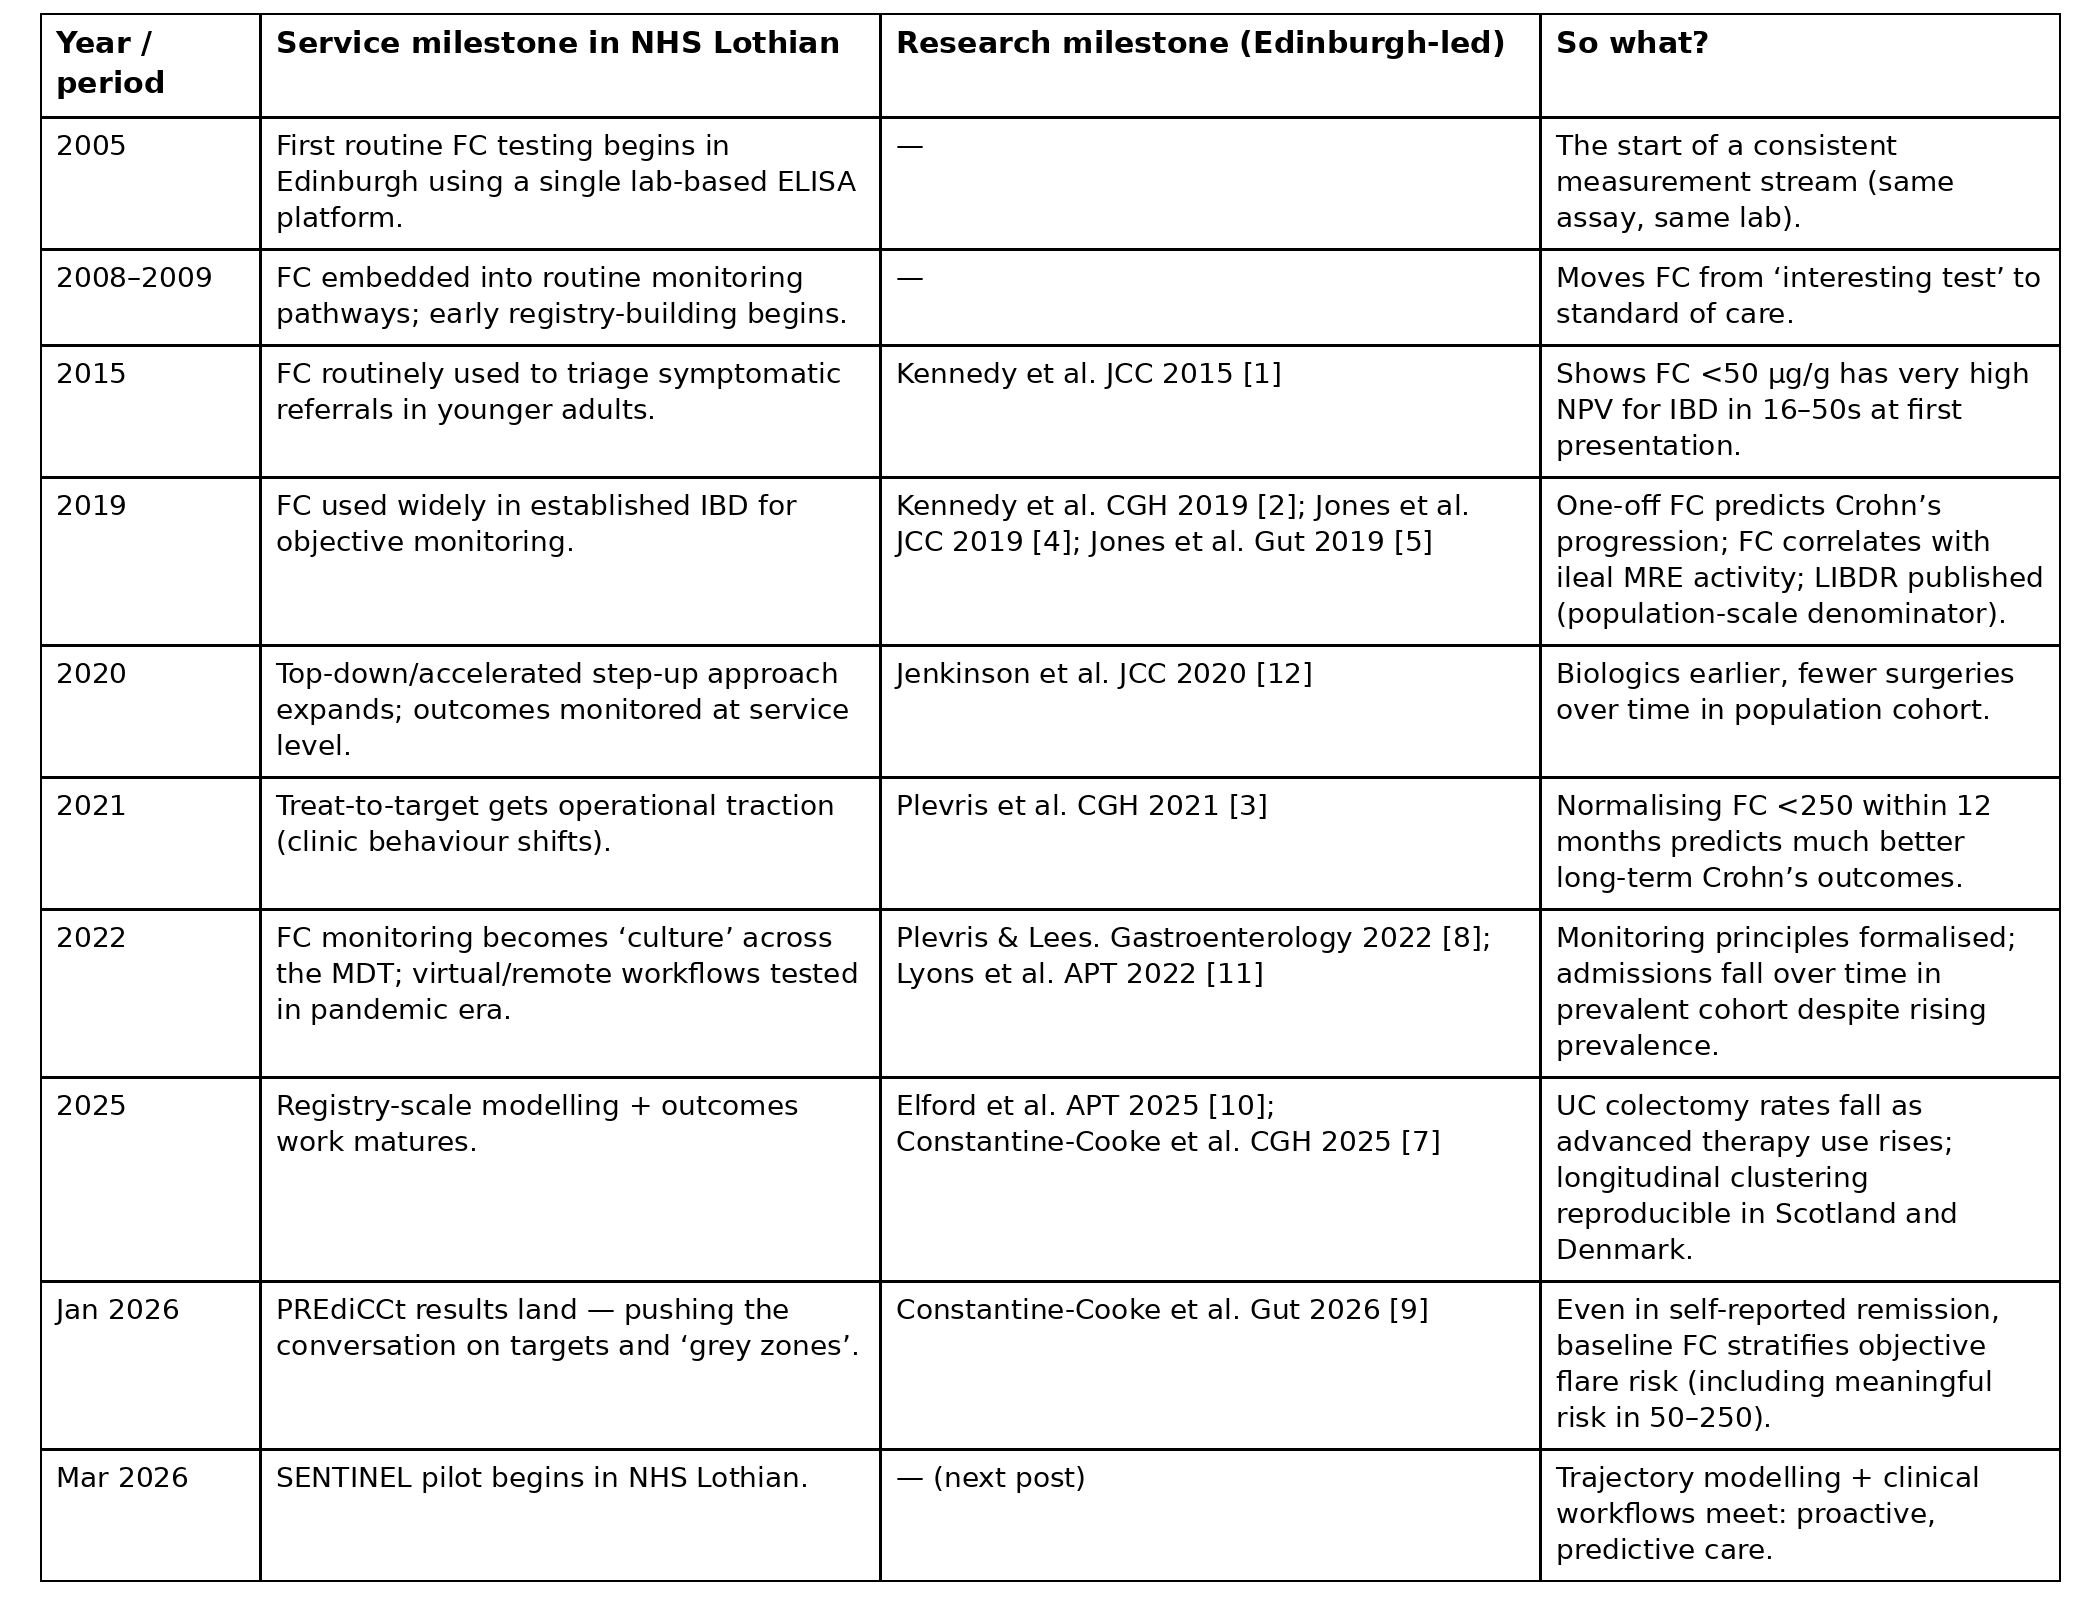
In 2005, we started using a single lab-based ELISA assay for faecal calprotectin (FC) testing at the Edinburgh IBD Unit. By 2009, it was embedded in routine care. Two decades later, we’ve run hundreds of thousands of FC assays in total (now tens of thousands per year), built a research programme on top of that data stream, and we’re using it to set the scene for what comes next, including a follow-up post on SENTINEL.
TL;DR
FC let us stop guessing about inflammation, at scale, across a whole health board.
The “250 rule” made FC usable in real life (trend is the art; thresholds are the language).
PREdiCCt suggests the “grey zone” (50–250) isn’t benign — and SENTINEL is how we unlock the true power of trends.
What we’ll cover
Why FC solved a problem that scopes and symptoms alone couldn’t
The Edinburgh studies (triage → prognosis → treat-to-target → trajectories)
The single simplest message that made FC usable at scale (and why SENTINEL matters)
The Problem We Were Trying to Solve
IBD is defined by inflammation, and while symptoms can be brutal, they’re not a reliably calibrated proxy for what’s happening in the bowel wall. Sometimes symptoms and inflammation track perfectly. Sometimes they don’t: a patient can feel fine while inflammation smoulders; another can feel terrible from functional symptoms despite quiescent disease.
For decades, the only way to know for sure was to look inside.
Colonoscopy remains the gold standard, but you can’t scope everyone every time. It’s invasive, expensive, and capacity-limited. Cross-sectional imaging with MRI helps, particularly for small bowel Crohn’s disease. And increasingly, intestinal ultrasound (IUS) is gaining worldwide traction as a non-invasive monitoring tool that can be performed at the point of care. But we needed something simpler, cheaper, and repeatable. A window into the gut that didn’t require a camera or a scanner.
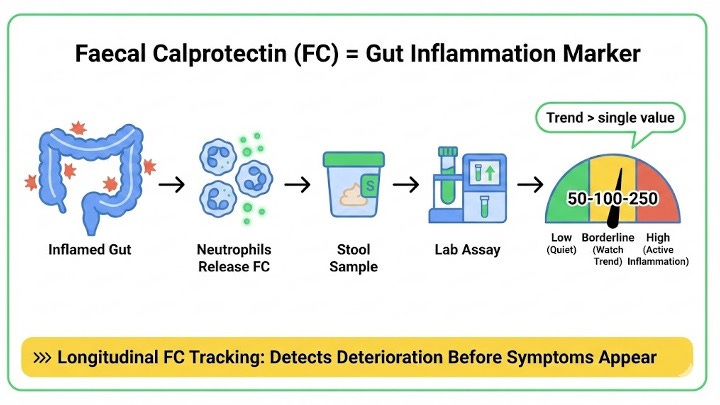
Faecal calprotectin offered exactly that. A protein released by neutrophils, measurable in stool, reflecting the degree of intestinal inflammation with remarkable fidelity. The technology existed. The question was: could we make it work in real clinical practice?
First Steps: Separating IBD from IBS
The first clinical challenge was triage. Young patients present with abdominal pain and altered bowel habit all the time. Most have irritable bowel syndrome. A minority have IBD. Identifying which is which, quickly and accurately, matters enormously.
Back in the late 2000s we deliberately focused on ages 16–50: once you get beyond that, the triage question isn’t just “IBS vs IBD” but also “could this be cancer?”, and most patients end up scoped anyway. These days we also have qFIT in the pathway. In practice, if FC <50 μg/g and qFIT <10 on two samples, the negative predictive value for serious organic disease is around 99%. Not yet a fully formalised pathway, but already useful for deciding who needs a scope urgently.
Nick Kennedy, my first clinical research fellow to tackle this problem, led a study that would become foundational. Nick is now a consultant gastroenterologist in Exeter, leading major research programmes there. Using data from the Edinburgh Faecal Calprotectin Registry, we examined 895 patients aged 16-50 presenting to gastroenterology services for the first time.
The results were striking. At a threshold of 50 μg/g:
Sensitivity for IBD: 97%
Negative predictive value: 99%
When combined with the absence of alarm symptoms, the NPV reached 100%. Not a single patient with FC below 50 and no alarm features had IBD.
The clinical translation was immediate: if your FC is low and you don’t have red flags, you almost certainly don’t have IBD. Colonoscopy can be safely avoided. During our study period alone, this would have prevented 200 unnecessary endoscopies, saving £88,000 in direct costs and, more importantly, sparing patients procedures they didn’t need.
This paper, published in the Journal of Crohn’s and Colitis in 2015, helped establish FC as a triage tool worldwide.[1]
Beyond Diagnosis: FC and Disease Progression
But diagnosis was just the beginning. The bigger question was whether FC could tell us something about the future. Not just whether someone has IBD, but how their disease would behave.
Nick Kennedy tackled this next. In a cohort of 918 Crohn’s disease patients followed for over 4,000 patient-years, we asked a simple question: does FC predict disease progression?
This was a deliberately pragmatic analysis: we anchored on a single FC value (the first non-diagnostic sample we had for each patient), rather than a trend, because that’s what we could do at scale at the time.
It did. Convincingly.
The optimal threshold was 115 μg/g, lower than the 250 μg/g commonly cited at the time. Patients above this threshold had a hazard ratio of 2.4 for disease progression, defined as a change in Montreal behaviour classification, surgical resection, or hospitalisation for severe flare.[2]
Crucially, this association held even in patients without symptoms. FC was capturing subclinical inflammation that would eventually declare itself, but might be treatable before it did.
The clinical message was clear: don’t just treat symptoms. Treat inflammation, because if you want to prevent bowel damage, you need to know the inflammation is there, even when the patient feels well.
Normalisation as a Treatment Target
If elevated FC predicts bad outcomes, does normalising it predict good ones?
Nik Plevris, another clinical research fellow who is now a consultant gastroenterologist right here in Edinburgh (we got to keep one Nik; wish we could have kept both!), led the work that answered this question.
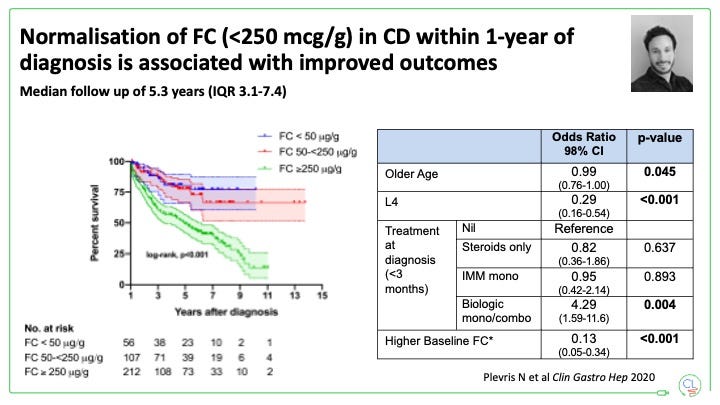
We looked at 375 newly diagnosed Crohn’s disease patients with elevated FC at diagnosis and asked: what happens if we get FC below 250 μg/g within the first year?
The answer: everything improves.
Patients who normalised their FC had:
64% reduction in disease progression (HR 0.36)
78% reduction in Montreal behaviour change (HR 0.22)
67% reduction in hospitalisation (HR 0.33)
61% reduction in surgery (HR 0.39)
At 7 years, the cumulative progression rate was 29.9% in normalisers versus 60.5% in non-normalisers. This wasn’t a subtle effect. It was transformative.
The paper, published in Clinical Gastroenterology and Hepatology in 2021, provided hard evidence for what we had suspected: FC normalisation should be a treatment target. It supported the “treat-to-target” approach that was gaining momentum internationally.[3]
Put simply: get FC down early, and you change the slope of the whole disease curve.
One question remained: does FC work for isolated small bowel Crohn’s disease, where MRI is the gold standard? Gareth Jones, another research fellow who is now a consultant gastroenterologist and mucosal immunologist in Glasgow (maybe we can lure him back across the M8 one day!), examined 119 MRE scans matched to FC measurements within 30 days. FC correlated well with MRI findings: the optimal threshold for detecting severe ileal inflammation was 145 μg/g, remarkably close to the 115 μg/g threshold we’d identified for predicting disease progression. And FC outperformed CRP for detecting MRI-confirmed disease activity.[4]
So what? If the bowel is smouldering in the ileum, FC usually tells you, and it tends to tell you better than CRP.
IUS is increasingly complementing both colonoscopy and MRI for monitoring, particularly in UC and colonic Crohn’s. It’s non-invasive, can be done at point of care, and is gaining huge traction globally. But FC and IUS are complementary rather than competing tools. Different jobs, both valuable.
How We Made FC Work in Practice
Having a good biomarker is one thing. Making it work in routine care across an entire health board is another. Our success in Lothian came down to a few very practical choices.
Same assay, always. We’ve used the same lab-based ELISA platform since 2005. Assay variability between different manufacturers is a real problem in FC testing. By sticking with one platform, highly optimised in our biochemistry lab at Western General Hospital, we’ve avoided the confusion that comes from switching between systems with different thresholds.
Education at every level. This starts with the conversation at diagnosis, which I never outsource. I explain to every patient: IBD is progressive. It’s the inflammation that drives the progression. There’s a disconnect between symptoms and inflammation. And FC is the best way for us to monitor what’s really going on.
A patient-facing script (feel free to steal this)
“Symptoms matter, but in IBD they don’t always tell us what the inflammation is doing. Faecal calprotectin is our ‘smoke alarm’ for gut inflammation. If it’s low, that’s reassuring. If it’s rising, it often means trouble is brewing before you feel it. The goal isn’t obsessing over one number; it’s watching the pattern over time and acting early.”
And yes: accepting FC monitoring means giving us a scoop of your poo regularly, but it’s the price we pay for staying ahead of the disease.
The Edinburgh rule of 250
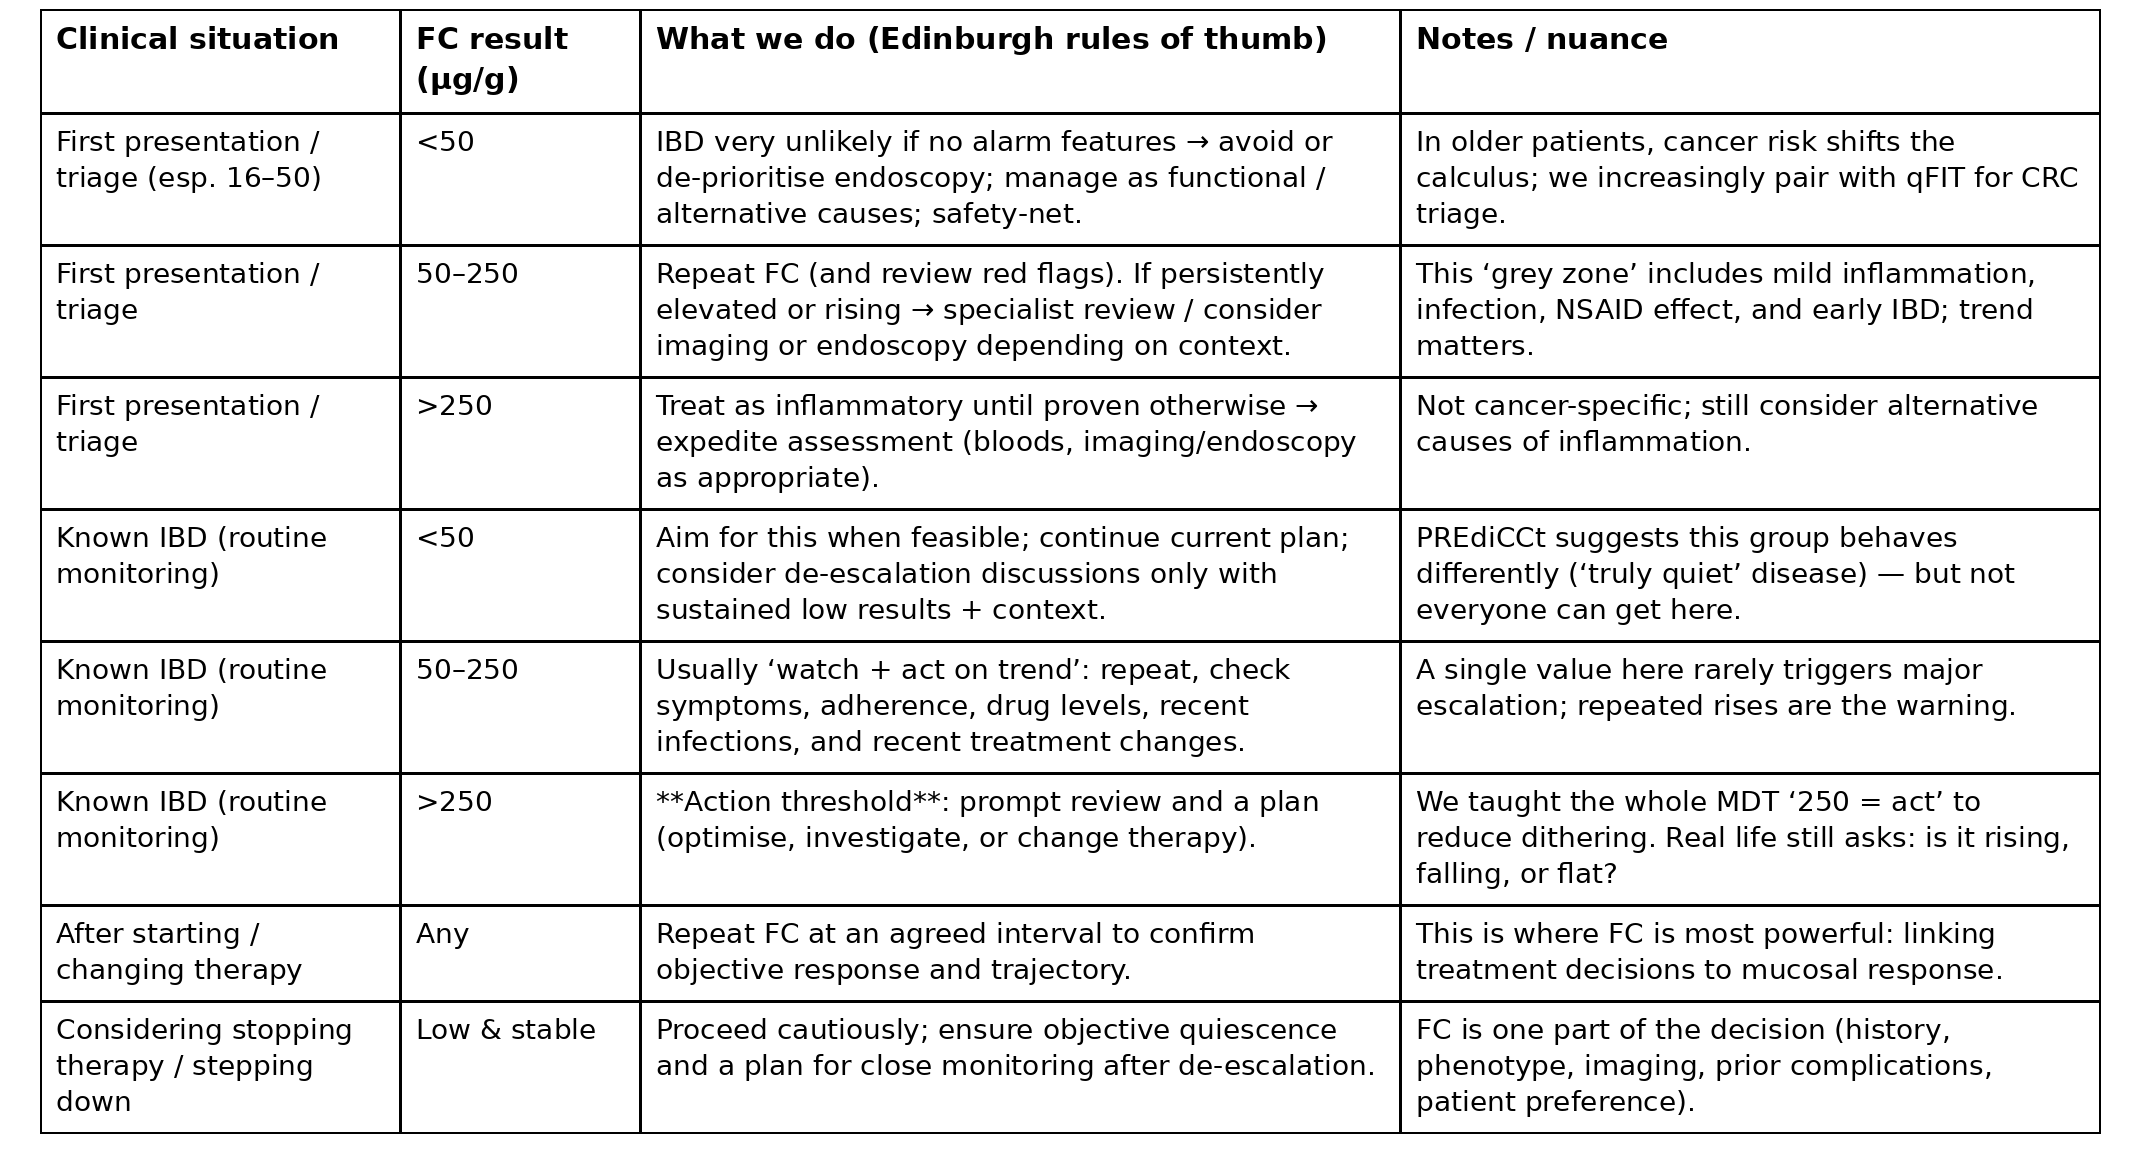
For well over a decade we taught everyone — doctors, nurses, junior staff, pharmacists, dietitians, administrators, and yes, even surgeons — that 250 μg/g is the level where you take action.
It sounds almost too simple, but that simplicity mattered. It stopped dithering, reduced variation, and gave patients a clear message.
Of course the real art is the trend, because what “normal” looks like is highly individual. But trend-following is hard to do consistently in real life when you’re usually staring at the last 2–3 results. SENTINEL is designed to unlock the true power here.
Practical logistics. Kits are ready at every clinic, handed out by staff who know how to talk patients through the process. Samples are collected at home (FC is stable at room temperature for around 3–4 days, which helps), then dropped at the GP surgery where they go on the sample van to our central biochemistry lab.
Risk-stratified frequency. Higher risk patients check every 2 months. Medium risk every 4-6 months. Lower risk annually. FC at every clinical interaction. Additional samples at key timepoints: after treatment initiation, change, or cessation; during suspected flare; when checking therapeutic drug levels.
Cost. The FC ELISA costs about £10-12 per assay in our lab. A bargain for the information it provides.
We trialled home testing with IBDoc and CalproSmart during the pandemic. It works, but the results are less reliable than lab ELISA, more expensive, and don’t flow automatically into our labs database. For now, the postal kit to GP to central lab pathway remains our standard.
The result? The proportion of our IBD population undergoing FC monitoring has climbed steadily year on year, with a mirrored reduction in sigmoidoscopy and colonoscopy for disease monitoring. Patients are empowered to ask about their FC results. It’s become part of the culture of IBD care in Edinburgh.[8]
The biomarker was easy. The behaviour change was the hard part, and that’s what scales.
PREdiCCt: A More Ambitious Target?
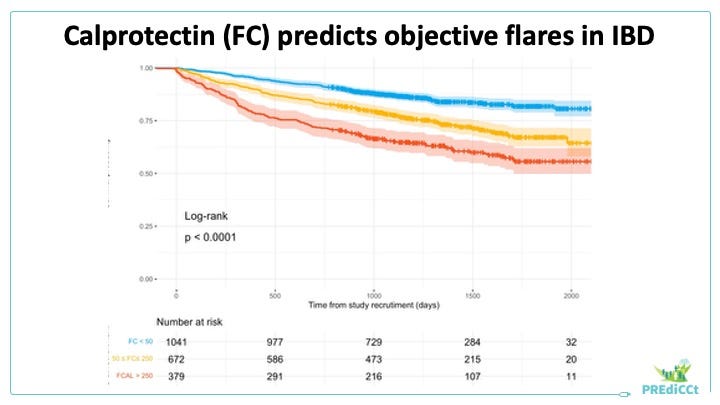
PREdiCCt is a prospective cohort study of 2,629 IBD patients across 47 UK centres. We designed it to identify factors associated with disease flare in patients in self-reported clinical remission.
The FC findings, published in Gut in January 2026, challenge current practice.[9]
We stratified patients into three groups:
FC <50 μg/g (52% of patients)
FC 50-250 μg/g (30%)
FC >250 μg/g (18%)
These were patients who told us they felt well. Nearly one in five still had FC >250 at baseline, and many more sat in the “grey zone” between 50 and 250.
PREdiCCt: the “grey zone” isn’t grey
Even in patients who feel well, FC 50–250 μg/g carried more than double the 2-year risk of objective flare compared with FC <50.
FC <50: 8% objective flare at 2 years
FC 50–250: 20%
FC >250: 26%
In adjusted analyses, FC 50–250 had HR 1.98 and FC >250 had HR 3.25 for objective flare (vs FC <50).
What does this mean for practice? It suggests that patients who consistently track below 50 μg/g behave differently. They have genuinely quiescent disease. This is a highly desirable place to be.
But should FC <50 become “the new treatment target”? Here we need to be careful. We must not let the perfect be the enemy of the good. For many patients, getting to FC <50 simply isn’t achievable with current therapies. Setting an unattainable target risks therapeutic nihilism and patient demoralisation.
We also know that lower FC thresholds correlate with histological healing in UC, with values around 70-75 μg/g associated with histological remission in some studies. So there’s biological plausibility to aiming lower than 250. But the clinical reality is that 250 remains a sensible, achievable target for most patients, and getting there still delivers major benefits.
The message from PREdiCCt is not “250 was wrong”. It’s that “lower is better if you can get there”, and that the 50-250 range is not the same as being below 50. The “grey zone” is a risk signal, not a shrug.
Unlocking the Trend at Scale: The Lothian IBD Registry
If thresholds are the language, then trajectories are the story. But you can’t do trajectory thinking without the right infrastructure.
In Edinburgh, we’ve been fortunate to build something unusual: a comprehensive, validated, population-based IBD registry linked to every FC measurement performed in the region.
Gareth Jones led the publication describing this resource in Gut in 2019. The Lothian IBD Registry (LIBDR) covers nearly 900,000 people, 16.5% of Scotland’s population, with case ascertainment completeness of 94.3%.[5]
By 2018, IBD prevalence in Lothian had reached 784 per 100,000: 1 in 125 people. We projected this would rise to 1 in 98 by 2028. The ageing of our IBD population presents new challenges: by 2028, patients over 40 will outnumber our entire current caseload.
Recently, we’ve fully integrated LIBDR with Lothian’s DataLoch, giving us an even richer research resource linking IBD data with the broader health and social care data ecosystem.
The registry gave us the foundation for everything that followed. Every FC measurement, linked to every patient, across every clinical encounter.
So what? It turned FC from a test into a dataset, and it meant we could start asking better questions than “what’s your number today?”
Enter Data Science: Modelling Longitudinal Inflammation
By the early 2020s, we had two decades of FC data. Tens of thousands of measurements. But we were still thinking about FC in static terms: one measurement at a time, threshold-based decision making.
Nathan Constantine-Cooke changed that.
Nathan joined us as a data scientist, first as a PhD student and now as a postdoctoral researcher. His question was elegantly simple: instead of looking at individual FC values, what if we modelled the trajectories? Could we identify patterns of inflammatory behaviour that capture disease heterogeneity better than traditional classification?
Critical to this work has been our collaboration with Catalina Vallejos, who co-supervised Nathan’s PhD and now effectively co-supervises all the data scientists in my group. Her statistical expertise has been fundamental to everything we’ve done in this space.
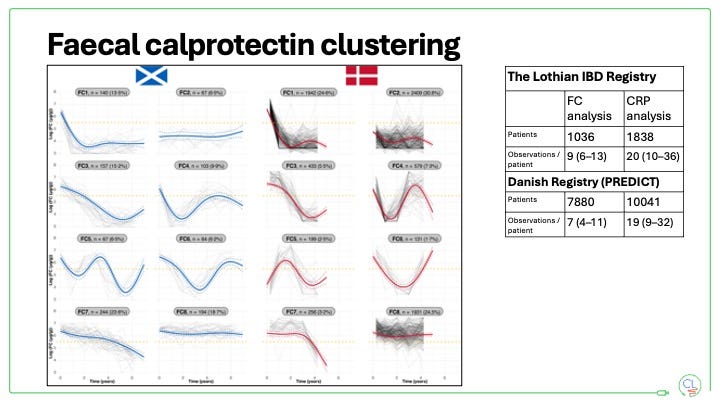
Using latent class mixed models (LCMMs), Nathan analysed 2,856 FC measurements from 356 newly diagnosed Crohn’s disease patients.
Four distinct trajectory clusters emerged:
Early rapid responders (26%): sharp FC decrease immediately after diagnosis, sustained remission (46% received early biologic therapy)
Persistently elevated (54%): FC remains high throughout follow-up, never dropping below 250 μg/g (only 18% received early biologics)
Delayed responders (16%): improvement, but not until about a year after diagnosis
Loss of response (4%): initial improvement followed by recurrence, the classic secondary loss-of-response pattern
This was no longer about single FC values. It was about understanding disease behaviour over time. The paper, published in Clinical Gastroenterology and Hepatology in 2023, introduced a new way of thinking about IBD phenotyping.[6]
If you’re trying to practice treat-to-target properly, this matters, because trajectories capture the behaviour of the disease, not just the last result.
Expanding the Framework: FC and CRP Together
Nathan’s next step was to expand this approach: larger cohorts, longer follow-up, and integration of CRP alongside FC.
This work involved a major international collaboration with Professor Tine Jess, who established the PREDICT centre for the molecular prediction of IBD in Denmark. Marie Vestergaard led the Danish analysis. The collaboration has been so productive that I’m now formally an adjunct professor at Aalborg University.
The results, published in Clinical Gastroenterology and Hepatology in December 2025, analysed 1,036 Scottish patients in the FC discovery cohort with replication in 7,880 Danish patients, and separately, 1,838 Scottish patients in the CRP discovery cohort with replication in 10,041 Danish patients. Eight distinct inflammatory trajectory clusters emerged, reproducible across both cohorts.[7]
A crucial finding: FC and CRP trajectories don’t always align. Only 72% of patients in the most favourable FC cluster were also in low-CRP clusters. This makes biological sense. FC reflects mucosal inflammation while CRP captures systemic response. But it has profound implications for clinical decision-making.
So what? FC and CRP are telling you different things. If you only listen to one, you can miss the plot.
The Impact: Changing Outcomes in Lothian
Has any of this made a difference? The population-level data suggests it has.
Colectomy rates in ulcerative colitis have fallen dramatically. From 2.48 per 100 UC patients in 2004 to just 0.22 per 100 in 2023, a 91% reduction. Advanced therapy prescribing increased in parallel, with a critical inflection point in 2013 when both trends accelerated.[10]
We’ve seen a similar direction of travel in Crohn’s disease since adopting a more top-down approach for newly diagnosed moderate-to-severe cases around 2015, with falling surgical rates over time. We’re currently working on an updated analysis, but the earlier dataset is already published.[12]
IBD-related hospitalisations have declined too. Age-standardised admission rates fell from 39.4 per 100,000 population in 2010 to 25.5 in 2019, a 36% reduction, with an average annual decrease of 3%.[11]
Let’s be clear about what’s driving this. The improved outcomes are largely down to new drugs in both CD and UC, and using them better. Top-down therapy in CD over the last decade has been transformative. We have more effective treatments and we’re deploying them earlier and more aggressively.
But treat-to-target with FC has undoubtedly changed the game too.
It’s given us the objective feedback loop we needed to know whether our treatments are actually working at the mucosal level. Correlation isn’t causation, and multiple factors contribute. But the temporal alignment is striking: as we’ve deployed FC-guided monitoring, escalated treatment earlier, and targeted inflammation rather than symptoms, hard outcomes have improved.
New drugs moved the ceiling. FC helped us stop walking into it.
What We’ve Learned
Twenty years of FC work in Edinburgh has taught us several things:
Lower is better, but 250 is still a sensible target for most. FC <50 μg/g represents genuinely quiescent disease, but achieving this isn’t always possible. Getting below 250 still delivers major benefits. Don’t let perfection be the enemy of good.
Trajectories matter more than snapshots. A single FC value is useful; a pattern over time is transformative.
Symptoms and inflammation diverge. Patients can feel well while inflamed, and feel terrible without inflammation. FC provides the objective ground truth.
Early effective therapy works. Patients who achieve FC normalisation early have dramatically better outcomes.
Implementation matters. Same assay, educated patients, practical logistics, and a culture of monitoring throughout the clinical team.
Infrastructure enables insight. LIBDR, with every FC linked to every patient, made this entire body of work possible.
The People Behind the Programme
This story is also a people story.
It starts with clinical fellows asking practical questions (Nick Kennedy on triage and prognosis; Nik Plevris on early normalisation; Gareth Jones on imaging correlation and the registry; Elliot Gemmell picking up the baton), and it now includes a data science group that lets us see the disease in motion (Nathan Constantine-Cooke and Catalina Vallejos, Victor Padro and Alex Rudge), plus the wider collaborations that let us test whether ideas generalise.
And none of it works without the multidisciplinary clinical system: nurses, pharmacists, dietitians, administrators, lab scientists, and yes, surgeons, all speaking the same simple language when they look at an FC result.
What Comes Next: SENTINEL
All of this has been building toward something.
We’re now building SENTINEL, an AI-driven clinical decision support tool for IBD. It’s the product of everything we’ve learned: two decades of FC data, trajectory modelling, and a clearer understanding of what predicts outcomes.
Here’s the problem SENTINEL is built to solve: even when you know trends matter, the reality of clinic is that you’re often looking at the last two results, in a patient you haven’t met before, on a busy Tuesday afternoon.
SENTINEL is designed to change that.
Imagine an IBD service that can see which patients are quietly losing control, not next week when they call with symptoms, but now, from the biomarker data we already collect. A system that spots drift, flags risk, and nudges the right action before the crisis.
We’ll start by piloting it in NHS Lothian, then iterate and scale with partner centres. I’ll cover the build, the workflow, and what we’re measuring in the next post.
But it’s important to understand that SENTINEL didn’t emerge from nowhere. It’s the culmination of a 20-year journey: from the first FC assays in 2005, through foundational work on diagnosis and prognosis, to longitudinal modelling and population-level outcomes.
The simple stool test turned out to be more important than we ever imagined.
Next in this series: SENTINEL — Building an AI-Driven Future for IBD Care
References
Edinburgh / Lothian work
[1] Kennedy NA, Clark A, Walkden A, et al. Clinical utility and diagnostic accuracy of faecal calprotectin for IBD at first presentation to gastroenterology services in adults aged 16–50 years. J Crohns Colitis. 2015;9(1):41–49. doi:10.1016/j.crohns.2014.07.005.
[2] Kennedy NA, Jones G-R, Plevris N, et al. Association between level of fecal calprotectin and progression of Crohn’s disease. Clin Gastroenterol Hepatol. 2019;17(11):2269–2276.e4. doi:10.1016/j.cgh.2019.02.017.
[3] Plevris N, Fulforth J, Lyons M, et al. Normalization of fecal calprotectin within 12 months of diagnosis is associated with reduced risk of disease progression in Crohn’s disease. Clin Gastroenterol Hepatol. 2021;19(9):1835–1844.e6. doi:10.1016/j.cgh.2020.08.022.
[4] Jones G-R, Fascì-Spurio F, Kennedy NA, et al. Faecal calprotectin and magnetic resonance enterography in ileal Crohn’s disease: correlations between disease activity and long-term follow-up. J Crohns Colitis. 2019;13(4):442–450. doi:10.1093/ecco-jcc/jjy187.
[5] Jones G-R, Lyons M, Plevris N, et al. IBD prevalence in Lothian, Scotland, derived by capture–recapture methodology. Gut. 2019;68(11):1953–1960. doi:10.1136/gutjnl-2019-318936.
[6] Constantine-Cooke N, Monterrubio-Gómez K, Plevris N, et al. Longitudinal fecal calprotectin profiles characterize disease course heterogeneity in Crohn’s disease. Clin Gastroenterol Hepatol. 2023;21(11):2918–2927.e6. doi:10.1016/j.cgh.2023.03.026.
[7] Constantine-Cooke N, Vestergaard MV, Plevris N, et al. Large-scale clustering of longitudinal fecal calprotectin and C-reactive protein profiles in inflammatory bowel disease. Clin Gastroenterol Hepatol. 2025 Dec 29:S1542-3565(25)01069-9. doi:10.1016/j.cgh.2025.12.022.
[8] Plevris N, Lees CW. Disease monitoring in inflammatory bowel disease: evolving principles and possibilities. Gastroenterology. 2022;162(5):1456–1475.e1. doi:10.1053/j.gastro.2022.01.024.
[9] Constantine-Cooke N, Gros B, Plevris N, et al. Associations between demographic, clinical and dietary factors and flares in inflammatory bowel disease: the PREdiCCt prospective cohort study. Gut. 2026 Jan 19:gutjnl-2025-337846. doi:10.1136/gutjnl-2025-337846.
[10] Elford AT, Constantine-Cooke N, Jenkinson PW, et al. Twenty-year trends in colectomy rates and advanced therapy prescribing in Lothian, Scotland. Aliment Pharmacol Ther. 2025;62(7):699–709. doi:10.1111/apt.70240.
[11] Lyons M, Derikx LAAP, Fulforth J, et al. Patterns of emergency admission for IBD patients over the last 10 years in Lothian, Scotland: a retrospective prevalent cohort analysis. Aliment Pharmacol Ther. 2022;56(1):67–76. doi:10.1111/apt.16867.
[12] Jenkinson PW, Plevris N, Siakavellas S, et al. Temporal trends in surgical resection rates and biologic prescribing in Crohn’s disease: a population-based cohort study. J Crohns Colitis. 2020; Advance Access Aug 25, 2020. doi:10.1093/ecco-jcc/jjaa044.
Other key calprotectin literature (summarised in Appendix below)
[13] Tibble J, et al. Gut. 2000;47:506–513.
[14] Van Rheenen PF, et al. BMJ. 2010;341:c3369.
[15] Mosli MH, et al. Am J Gastroenterol. 2015;110(6):802–819.
[16] Costa F, et al. Gut. 2005;54:364–368.
[17] Louis E, et al. Gastroenterology. 2012;142:63–70. (STORI)
[18] Mao R, et al. Inflamm Bowel Dis. 2012;18(10):1894–1899.
[19] Heida A, et al. Inflamm Bowel Dis. 2017;23(6):894–902.
[20] Shi J-T, et al. J Clin Med. 2023;12(3):1206.
[21] Colombel JF, et al. Lancet. 2017;390(10114):2779–2789. (CALM)
[22] Turner D, et al. Gastroenterology. 2021;160:1570–1583. (STRIDE-II)
[23] Wright EK, et al. Gastroenterology. 2015;148:938–947. (POCER)
[24] Boschetti G, et al. Am J Gastroenterol. 2015;110:865–872.
[25] Makanyanga JC, et al. Eur Radiol. 2014;24:277–287.
[26] Wei S-C, et al. Intest Res. 2018;16(4):546.
[27] Smith ES, et al. J Clin Gastroenterol. 2024;58(6):607–613.
[28] Foster AJ, et al. World J Gastroenterol. 2019;25(10):1266–1277.
Appendix: Table 3 (Global landmarks)
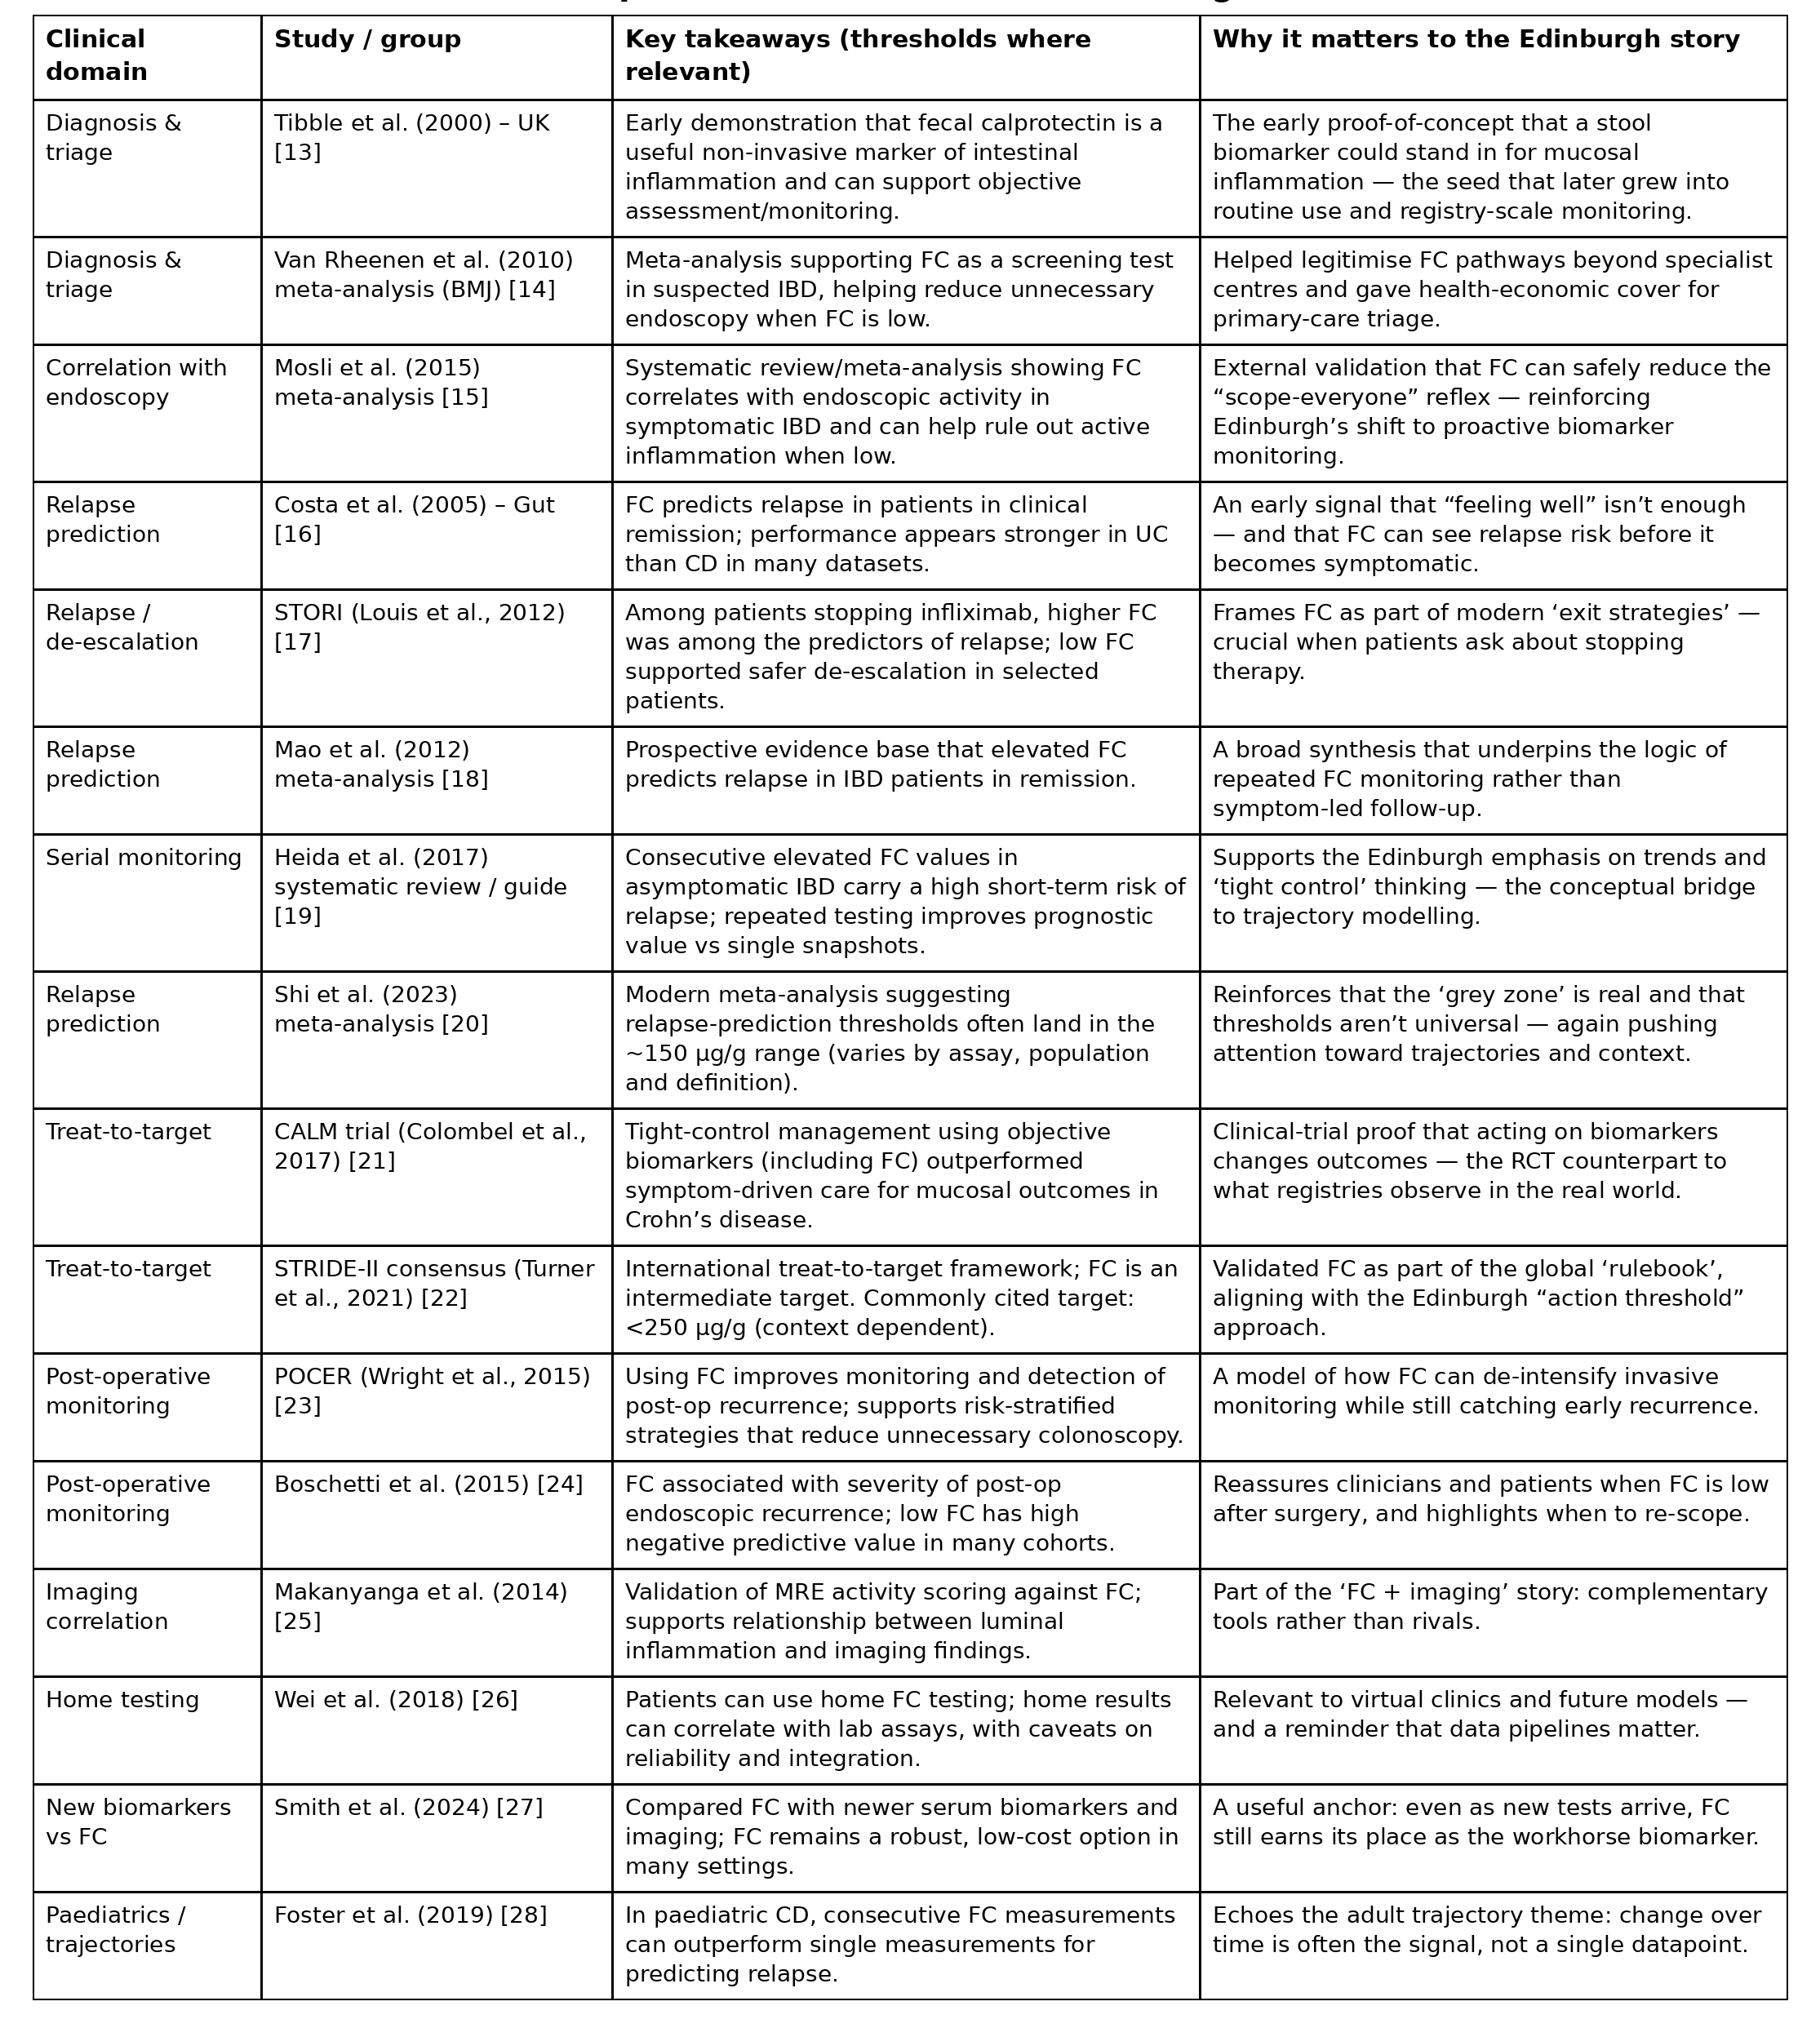
For readers who want the wider FC context beyond Edinburgh, here are the headline external studies and thresholds.
This resonates with a recent flare I had: “So what? FC and CRP are telling you different things. If you only listen to one, you can miss the plot.”
My CRP scores were relatively normal to slightly elevated throughout the flare. However, what was going on in reality was very different.
It’s only the last couple of weeks I’ve learnt that FC is more of a reliable or a better indicator and not to rely on the CRP marker alone.
Good luck with creating SENTINEL.
SENTINEL sounds a lot like the parent of an IBD patient. My child has come quite quickly into remission once treatment started having been fairly recently diagnosed however he has been ill/I have watched him being ill for a long time and it didn't surprise me at all that his most recent FC was higher than previous tests. Not high yet but my observations of his behaviour make me suspicious that he is fading again.
It would be fascinating to test the parents of paediatric patients against it one day. My interactions with other parents leads me to suspect that some humans might be almost competitive....